RAO on displacement
Last reviewed version: 2.18.0AquaEdit
Open the RAO-displacement.amodel in AquaEdit. Consider this one-element beam that is 10 meters long, where the end-nodes are free to move in any direction. The beam is assigned the load formulation Morison submerged, and has a cross section of 1m times 2 meters.
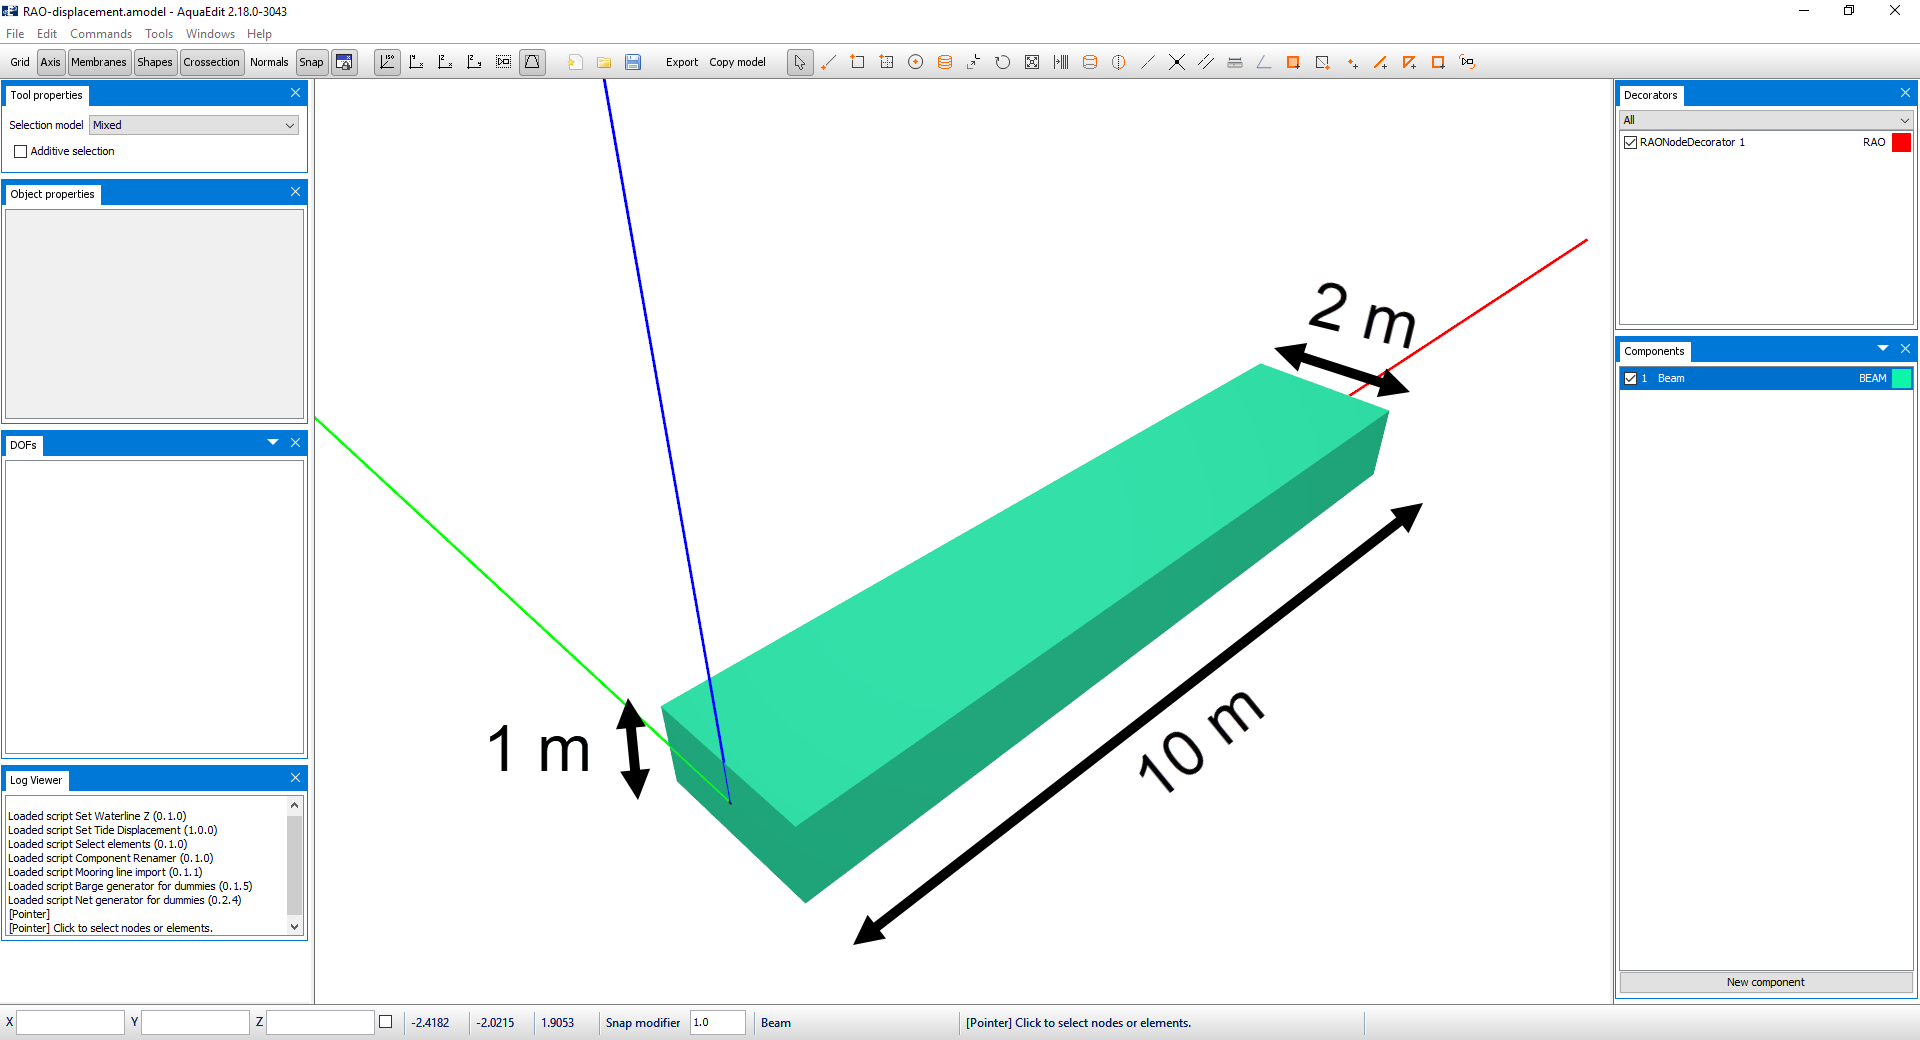
To assign a RAO on displacement one can Right click a node > Nodes > RAO > Create new. Having created an RAO, it will appear as a node decorator in the Decoratos window. We have prepared one in this model. Double click on RAONodeDecorator 1 in the Decorators window.
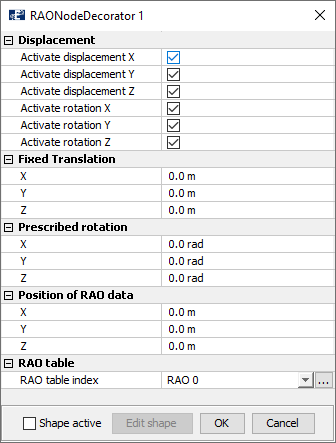
Applying response amplitudes to a node means specifying how the node is allowed to translate or rotate as a function an RAO table. In the section Displacement, one can toggle on which degrees of freedom (DOF) the amplitude operators should be activated for. Alle DOFs is in this case toggled on.
In Fixed translation, one can add a specific amount on translation of the node. Prescribed rotation defines rotations that can be added. Both Fixed translation and Prescribed rotation will be added upon the response amplitudes. Position of RAO data enables the user to specify another location for the origin of the RAO, rather than the node-position itself. In case the position of response data is not at the same location as the node, rotation will lead to a rotational arm at the node.
For response amplitude operators to work, you need to create a table. The table relates the displacement to either the environmental conditions or in time. A table is prepared in advance, so in the lower section, select the drop-down menu and select RAO 0.

To enter the table, select the three dots to the right.
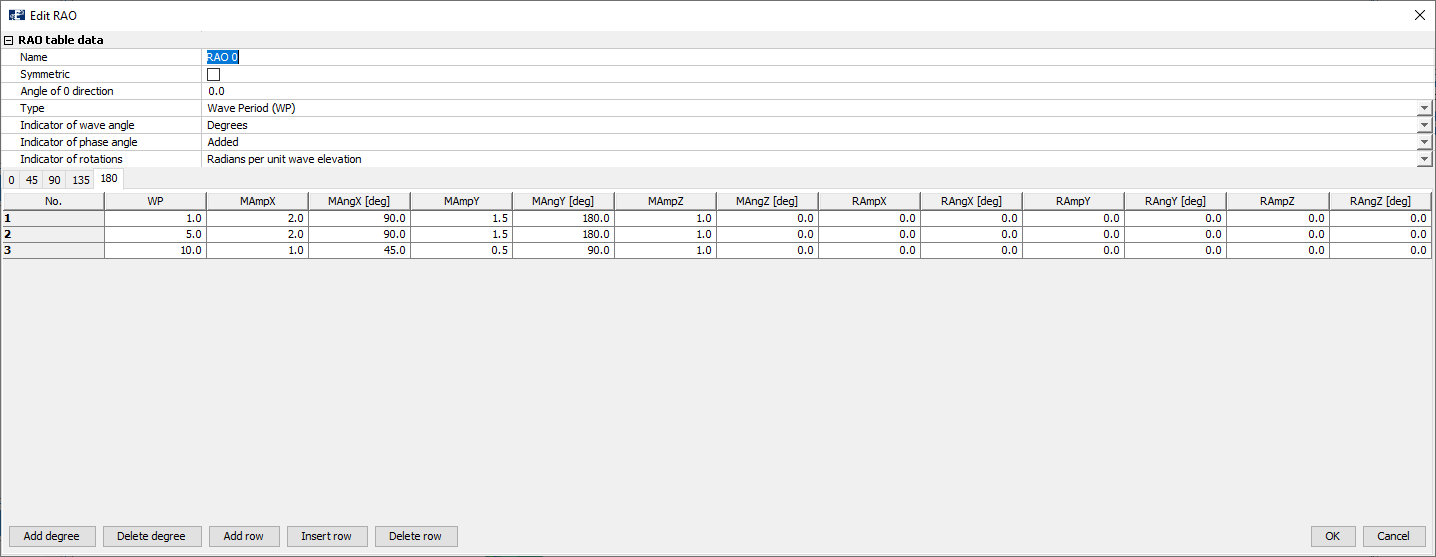
It is in this table you define the amplitudes and relates it to external conditions. This is found in the drop-down menu Type.
- Wave frequency (WF): the node will displace and rotate as a function of wave frequencies.
- Hertz frequency (Hz): the node will displace and rotate as a function of Hertz frequencies.
- Wave period (WP): the node will displace and rotate as a function of wave periods.
- Time: describes at which time instant (in seconds) that the node should translate or rotate.
We choose the RAO type to be as a function of Wave period (WP).
Wave angle may be given in degrees or radians, and one can select to add or subtract the phase angle between the wave amplitude and response. One can also choose to relate rotations to wave amplitude or wave steepness, as seen in Indicator of rotations.
The directions for the response amplitudes are defined through the Add degree. A new dialogue window will appear, here you type the direction. If Indicator of angle is Degrees, then the input in this window is in degrees. You may add several degrees, each degree will come out as an individual tab in the table. In our case we have prepared 5 different directions; 0 degrees, 45 degrees, 90, 135 and 180.
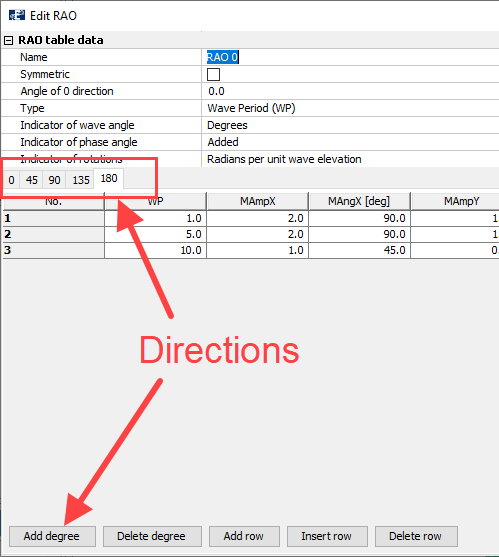
In each tab, you have fields to enter the wave period the response amplitudes should react to (WP) and the various amplitudes. MAmpX is the magnitude of the translatory response amplitude along x-direction. MAngX is the angle of displacement along x-direction. RAmpX and RangX are equivalent rotations about the x-axis. The other parameters are similar, only that they apply to y- and z-direction.
We are satisfied with the predefined values and exit the table and the RAONodeDecorator-window.
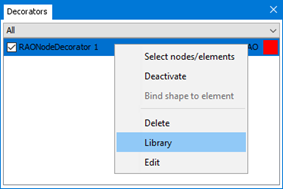
RAO can also be saved to the library in AquaEdit. Navigate to the Decorators window where the RAO is visible. Right click on RAONodeDecorator 1 and select Library.
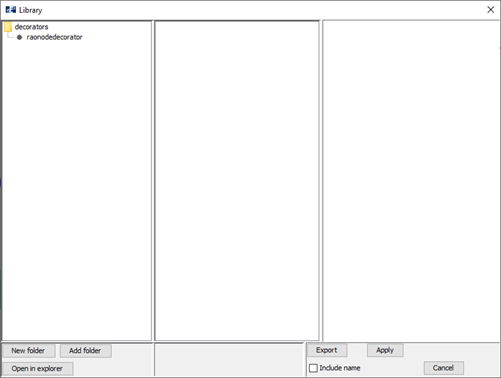
The Library window is loaded, and here you can Export (save) the Node decorator and the associated RAO table.
Analysis
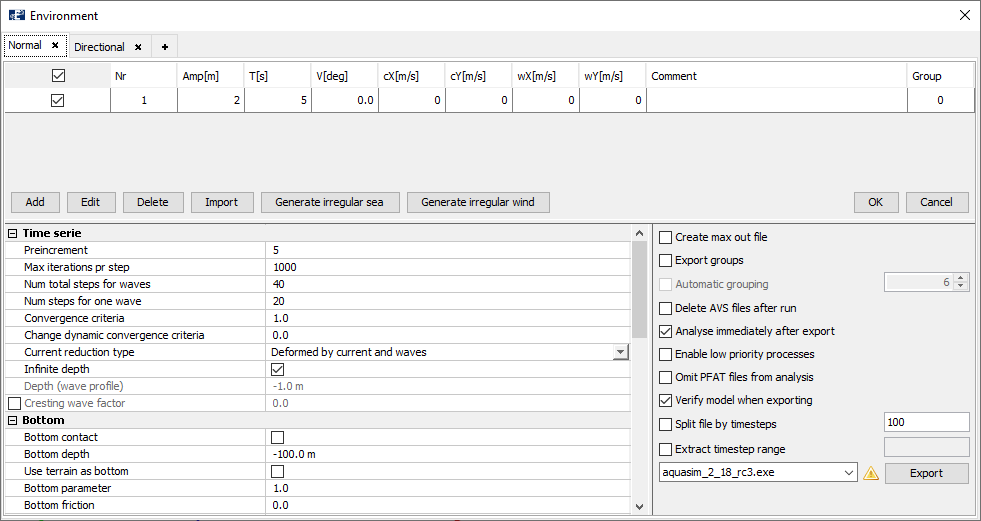
We are ready to run a dynamic analysis. Select Export and navigate to the Normal-tab in the Environment-window.
A load condition with a wave amplitude of 2 meters and wave period 5 seconds is prepared. The waves should propagate along the x-axis, this is seen in the V[deg]-section.
In the Time serie section, 5 initial steps are applied. The analysis should be run with two regular waves, each of 20 steps. This can be seen in the sections Num total steps for waves and Num steps for one wave.
Export the analysis and save it a suitable place. Then Start the analysis.
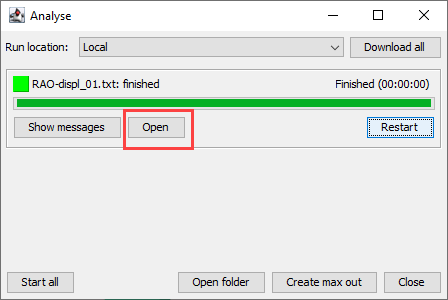
When the analysis is finished, select Open to load the results in AquaView.
Note: if you run in batch-mode, the result file is found in the folder where you saved the analysis. Double click the [name of analysis].avz to open it in AquaView.
AquaView
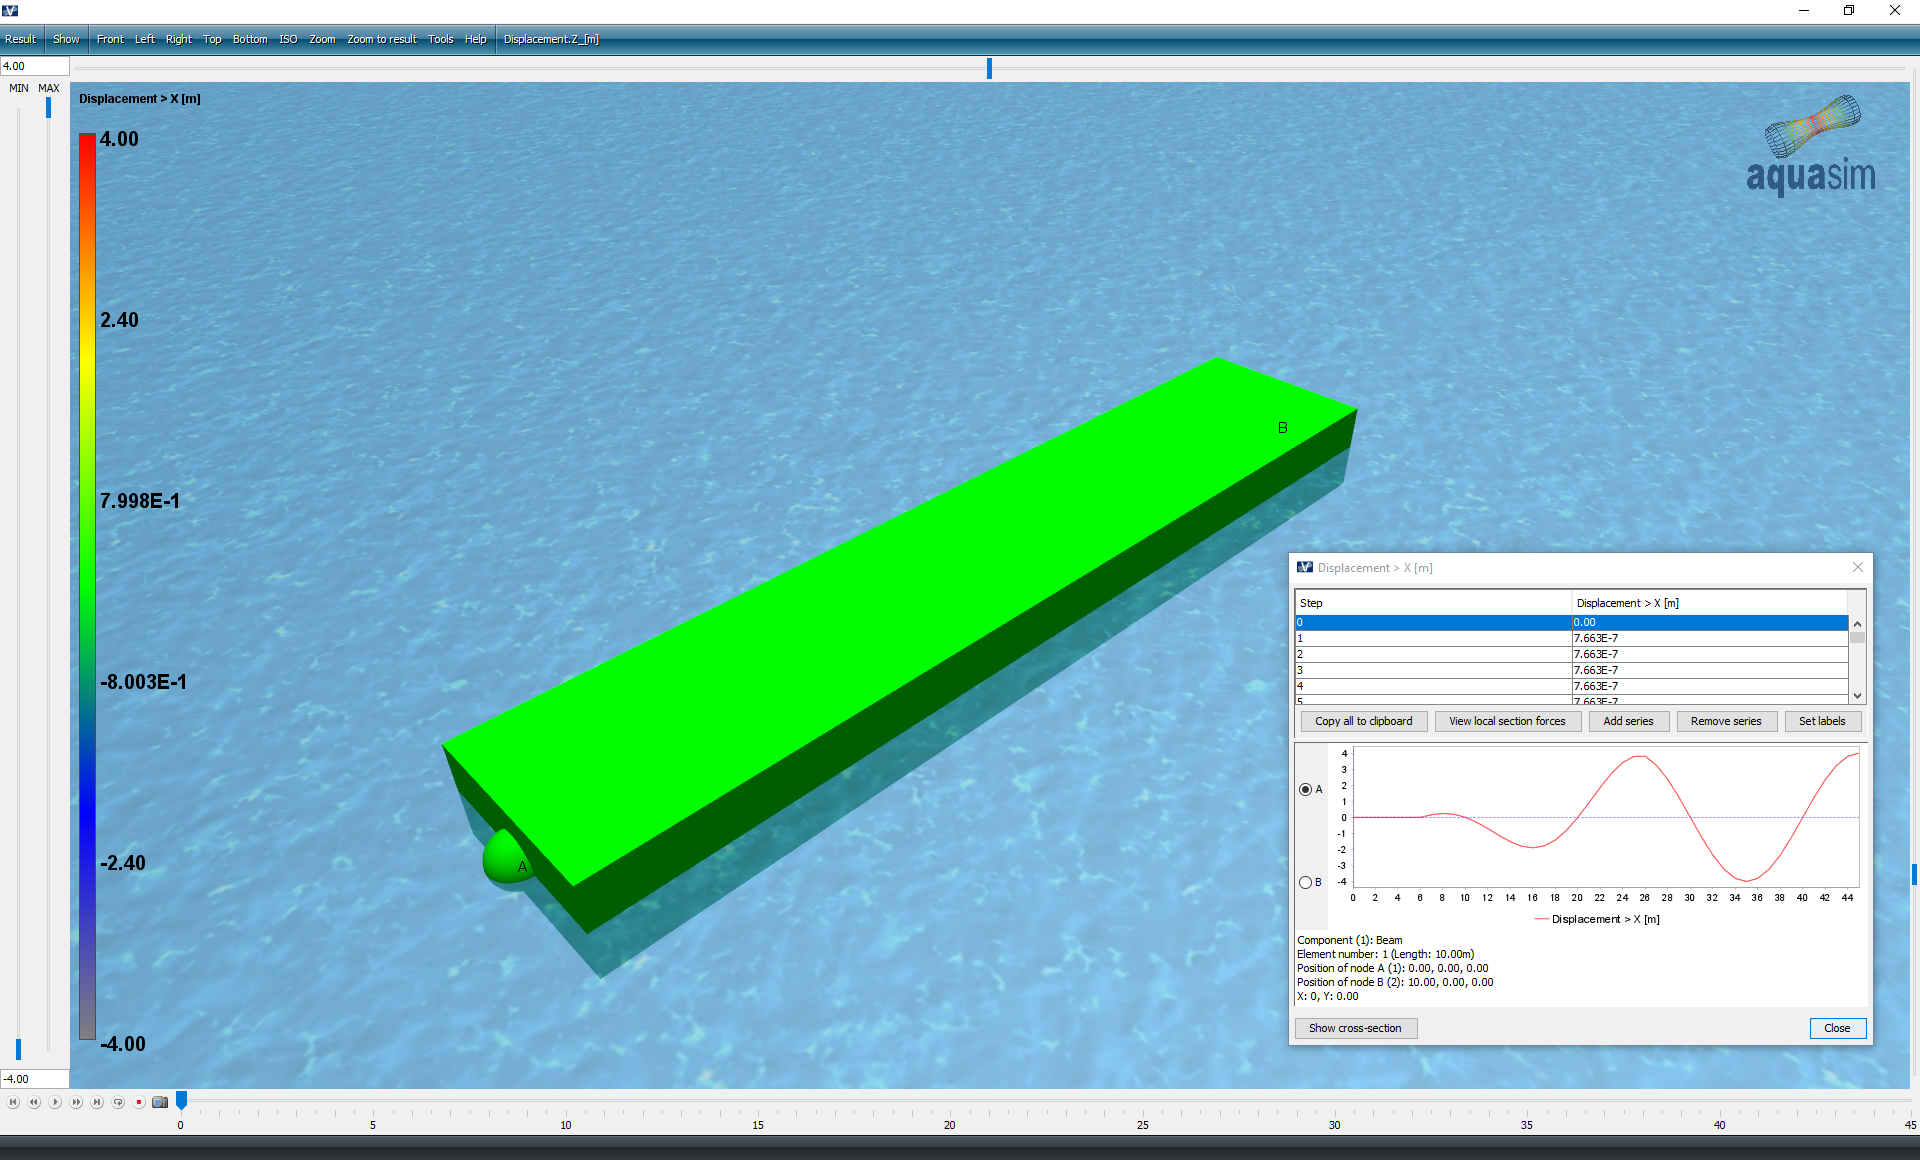
In AquaView, you can plot the displacements in x-, y- and z-direction. Let us start with x-direction: select Result > Displacement > Displacement X [m].
