Analysis compared with tank testing
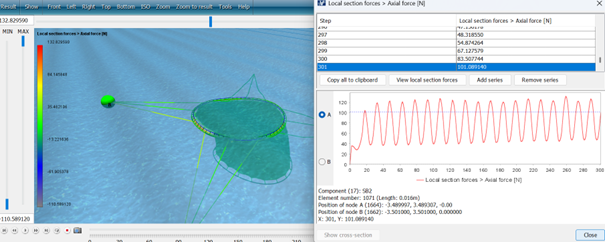
Last reviewed version: 2.22To evaluate how well the numerical model represents a lice skirt, a tube has been subject to tank testing, see reference (Aquastructures AS, 2019) and (Roaldsnes, 2020). Forces measured during tank testing were compared with AquaSim analyses applying different sets of parameters. The forces are compared in terms of axial force in bridles, as shown in Figure 21.
Three load cases have been investigated, with different combinations of current velocity and wave amplitude. These are presented in Table 4.
Table 4 Load cases investigated during tank testing
| Case 1 | Case 2 | Case 3 | |
|---|---|---|---|
| Current velocity [m/s] | 0.097 | 0.145 | 0.193 |
| Wave amplitude [m] | 0.0988 | 0.0988 | 0.0988 |
| Wave period, nominal [s] | 1.217 | 1.244 | 1.271 |
| Wave period earth fixed [s] | 1.158 | 1.158 | 1.158 |
Analyses have been conducted applying the “Hybrid flexible tarp/ Numerical diffraction” load formulation. Input parameters to AquaSim is presented in Table 5.
Table 5 AquaSim input parameters
| Analysis cases | Analysis 1 | Analysis 2 | Analysis 3 | Analysis 4 |
|---|---|---|---|---|
| Cd front | 0.50 | 0.80 | 1.00 | 1.20 |
| Cd back | 0.25 | 0.40 | 0.50 | 0.60 |
| Ct | 0.00 | 0.00 | 0.00 | 0.00 |
| Cl | 0.00 | 0.00 | 0.00 | 0.00 |
| Inner mass | 0.00 | 0.00 | 0.00 | 0.00 |
| Load formulation, Hybrid flexible tarp / Numerical diffr. | Yes | Yes | Yes | Yes |
| Diffraction scaling | 0.25 | 0.25 | 0.25 | 0.25 |
| Added mass coefficient horizontal | 0.25 | 0.25 | 0.25 | 0.25 |
| Added mass coefficient vertical | 0.25 | 0.25 | 0.25 | 0.25 |
| Added mass indicator (2 = conservative, actual water line) | 2 | 2 | 2 | 2 |
| Hydrodynamic damping coefficient horizontal | 0.25 | 0.25 | 0.25 | 0.25 |
| Hydrodynamic damping coefficient vertical | 0.25 | 0.25 | 0.25 | 0.25 |
| Damping coefficient (flexible tarp) | 1 | 1 | 1 | 1 |
| Damping coefficient (flexible tarp) tangential to panels | 0.05 | 0.05 | 0.05 | 0.05 |
| Include drift | Yes | Yes | Yes | Yes |
It should be noted that the parameter Damping coefficient (flexible tarp) was specified to 1.0, although the hybrid model suggests differently. It was found that this provided good agreement with the observed response of the tube. The default values of AquaSim parameters are generally set with conservatism in mind. However, the user must evaluate this case-by-case and make potential adjustments.
Case 1
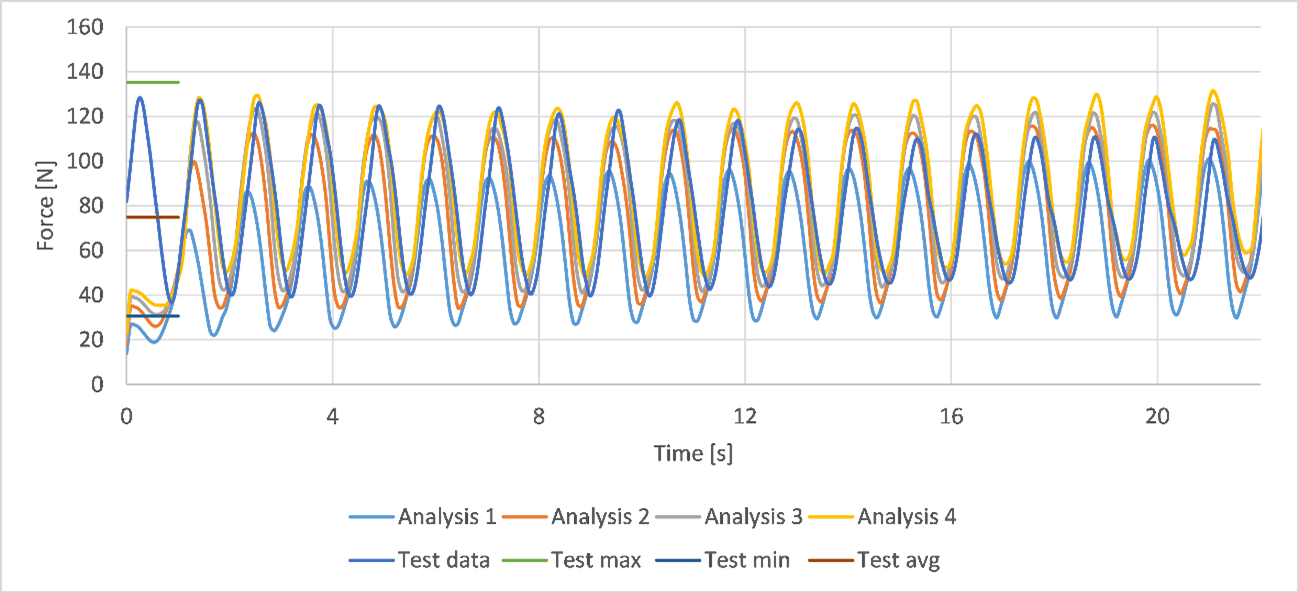
The measured test data has been compared with AquaSim analysis with a variation in drag coefficients, as seen in Figure 22.
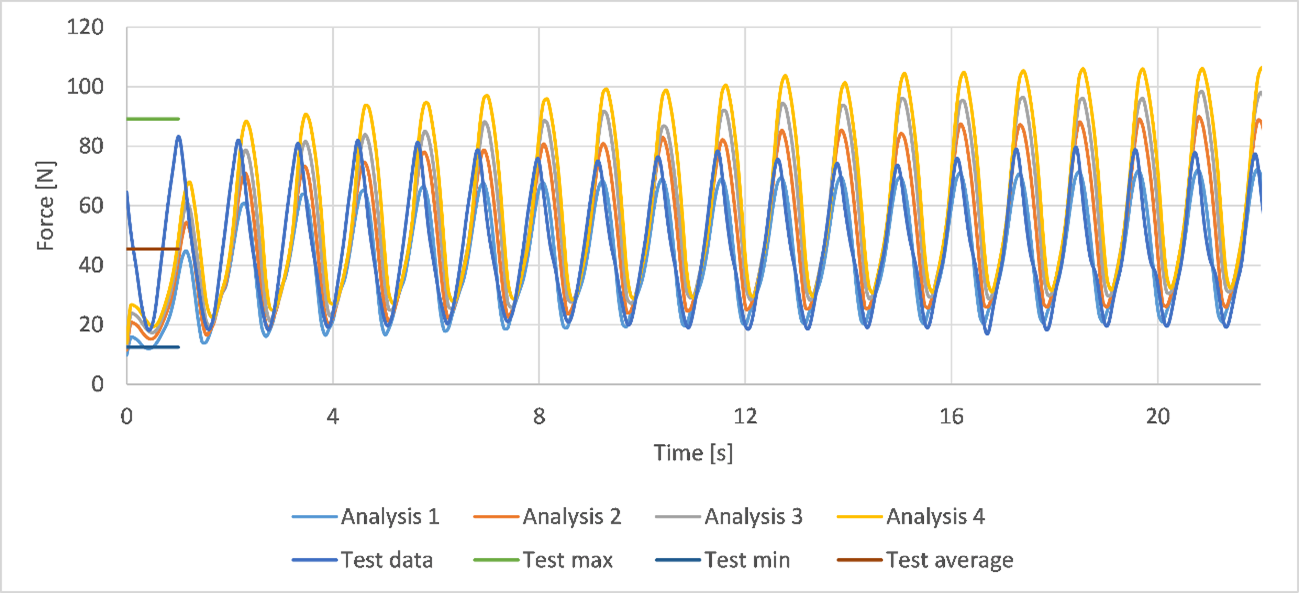
The different curves can be explained by:
- Analysis 1: AquaSim analysis with parameters as specified in Table 5.
- Analysis 2: AquaSim analysis with parameters as specified in Table 5.
- Analysis 3: AquaSim analysis with parameters as specified in Table 5.
- Analysis 4: AquaSim analysis with parameters as specified in Table 5.
- Test data: excerpt of the test data time series.
- Test max: observed maximum value from the full test data series (indicated on left side in Figure 22).
- Test min: observed minimum value from the full test data series (indicated on left side in Figure 22).
- Test average: the average value from the full test data series (indicated on left side in Figure 22).
When we evaluate the results and compare them, the response pattern is similar for all investigated analyses. What is characteristic about the analysis results is that the amplitude of the force increase with increasing drag coefficient. It is noted that the curve “Test data” only is an excerpt from the full time series, whereas the max, min and average are for the full data series.
Case 2
This case (see Table 4) has an increased current velocity compared with Case 1, whereas the wave amplitude is the same. The results from AquaSim analysis compared with tank test data are shown in Figure 23. Also, in this case it is observed that AquaSim results achieve similar response pattern as the test data. When we consider the amplitude of the load from AquaSim analyses and compare with the max- and min-values from test data we see that they fall reasonably within.
Case 3
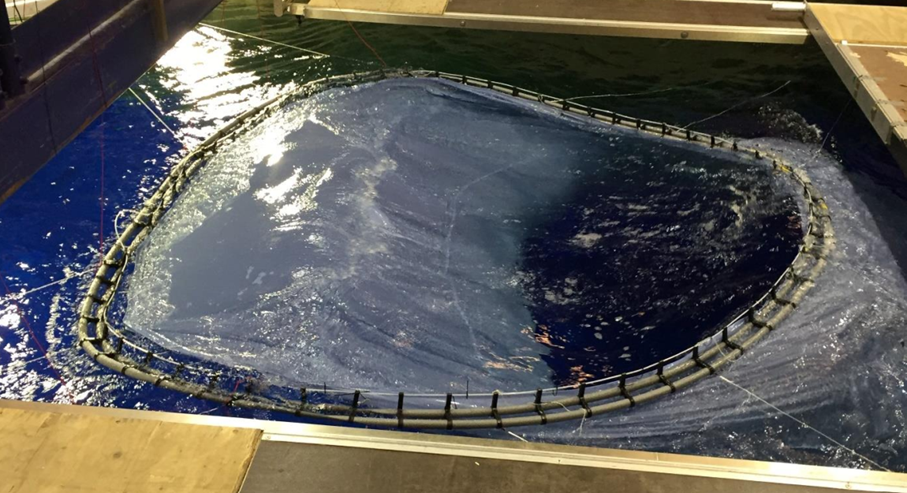
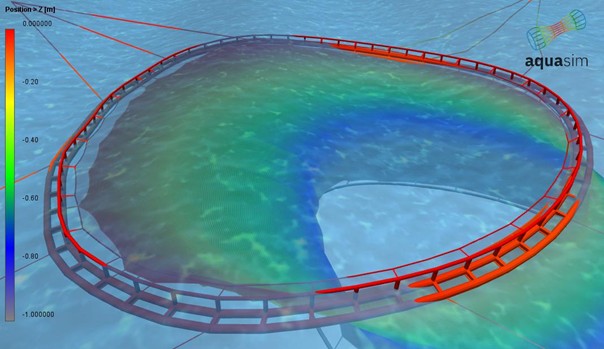
This case has also an increased current velocity compared with Case 2, whereas wave amplitude is the same. The results from AquaSim analysis compared with tank test data are shown in Figure 24.
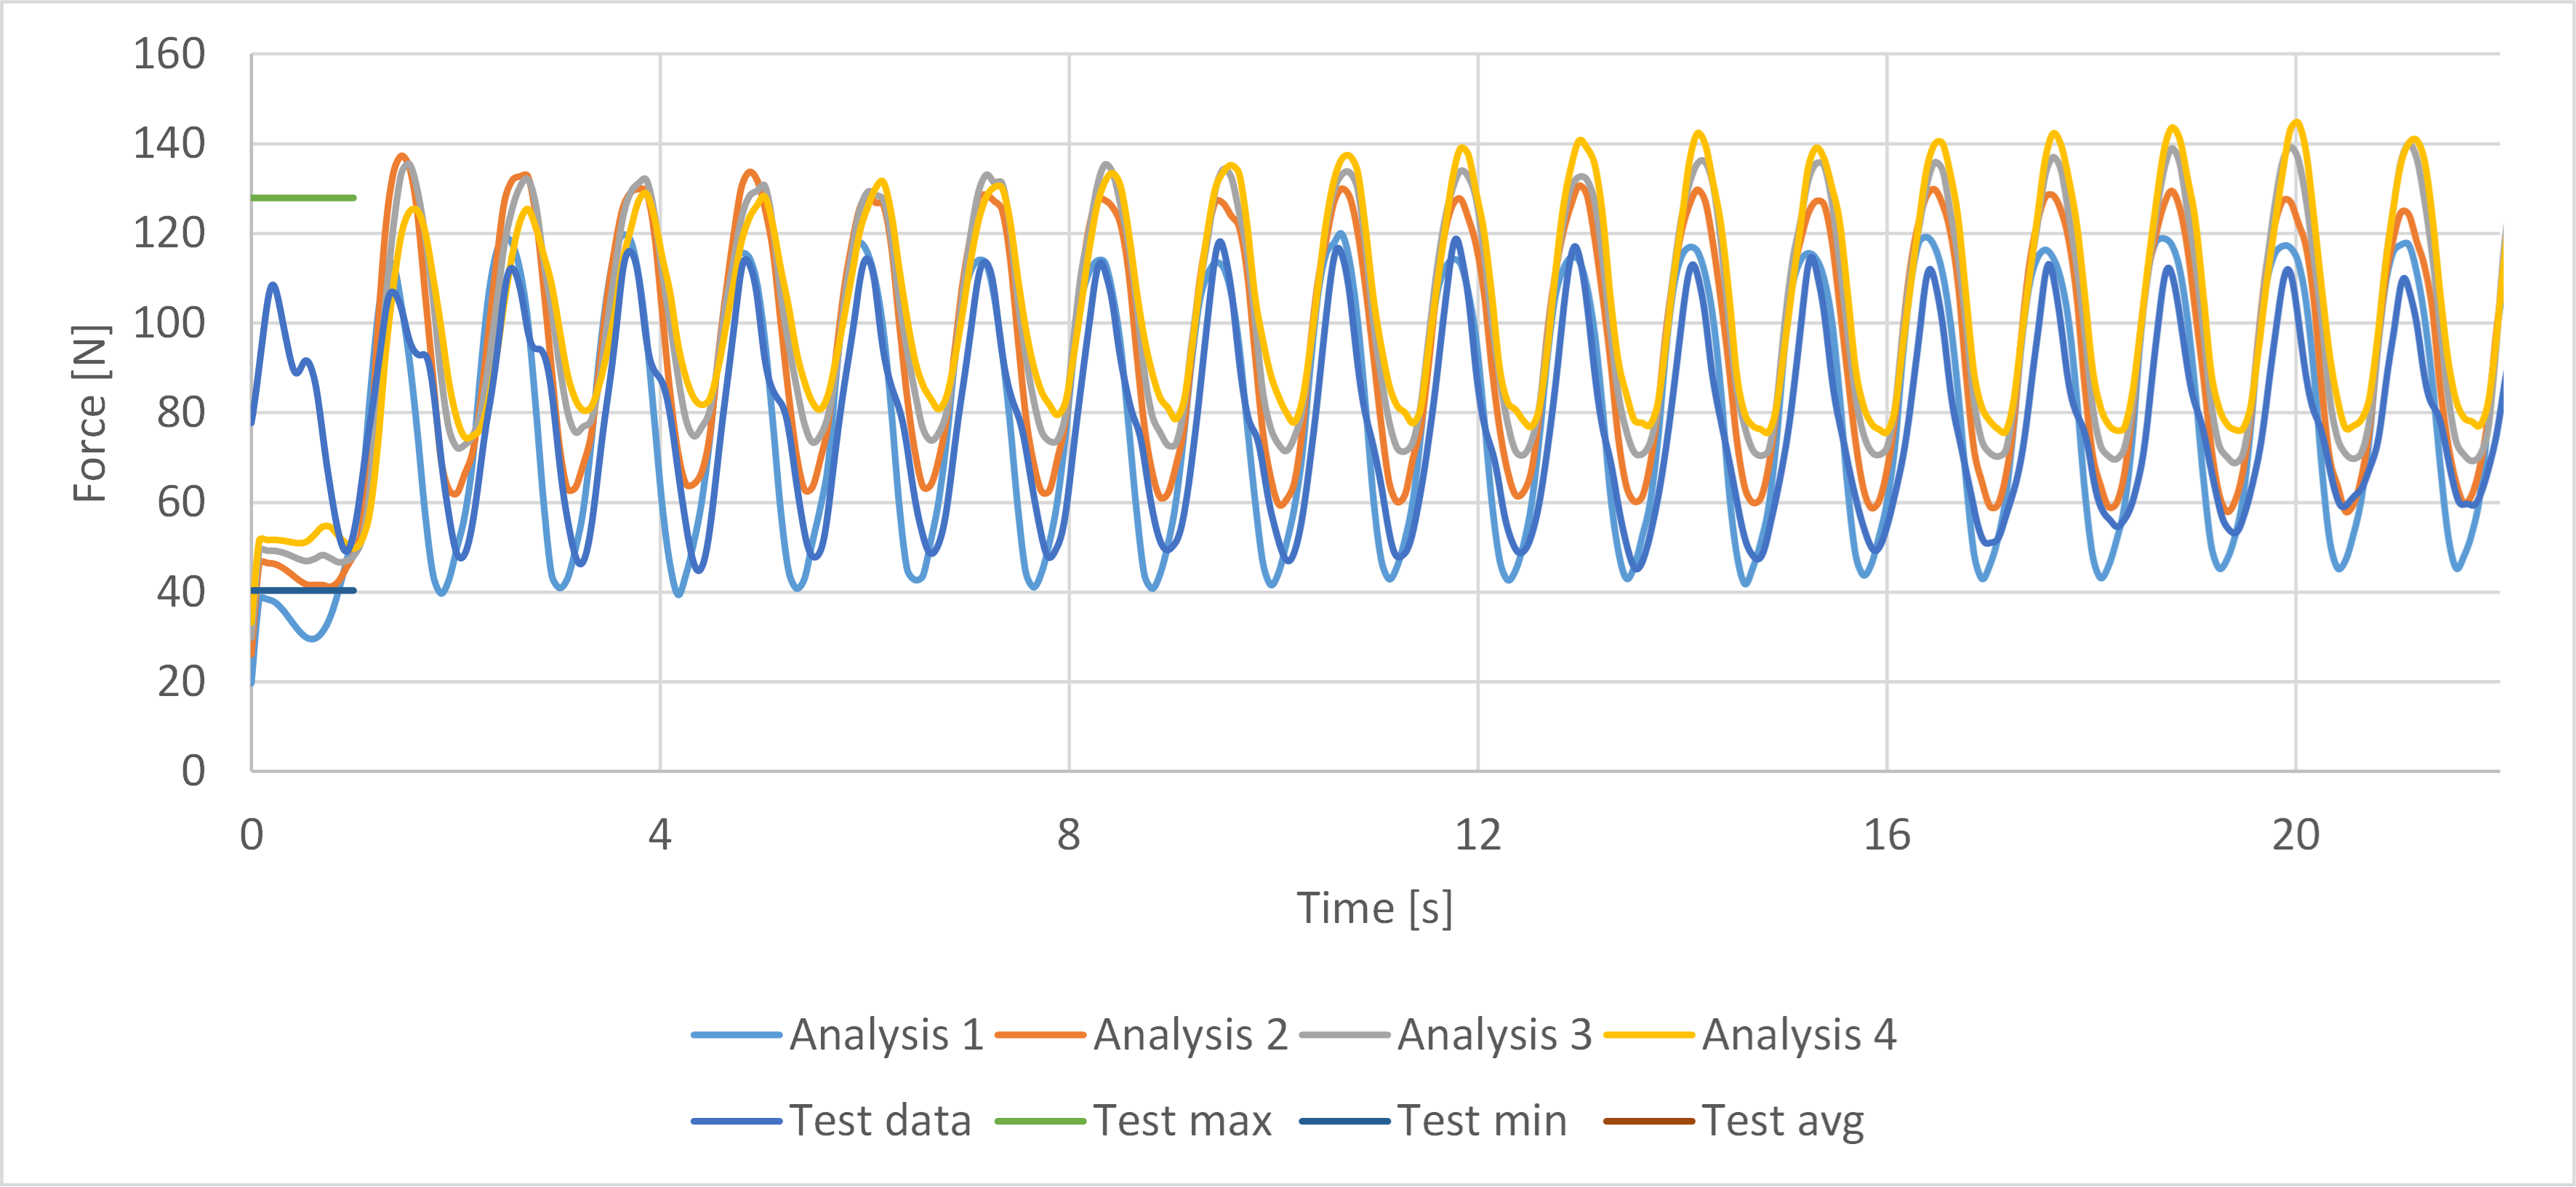
Figure 25 presents a photograph from the tank test Case 3, while the corresponding condition from AquaSim analysis is shown in Figure 26. The purpose of this presentation is to highlight selected similarities and differences between physical and numerical models. The upper section of the tube in the experiment appears adhered more to the water surface, both upstream and downstream. Suggesting that more fluid is entrapped along the tube compared with analysis. Although not illustrated here, the numerical model