Analysis of watertank
Last reviewed version: 2.22A static analysis, whit Export parameters as shown in Figure 9.
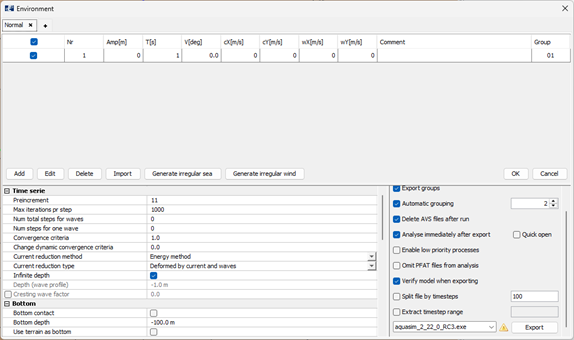
Figure 9 Export setting for AquaSim analysis
Results
When the analysis is completed, the results can be viewed by opening the analysis file *.avz in AquaView. Figure 10 shows the vertical position of the tank model when selecting Results > Location > Position Z [m].
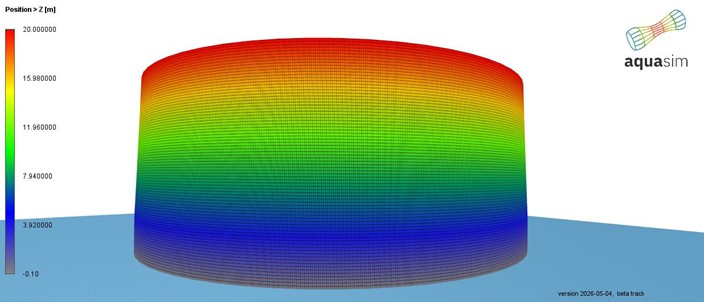
Figure 10 Vertical position of tank
Figure 11 shows the relative pressure at the center of each element. The pressure is evaluated at the element midpoint and color-mapped accordingly. Note that pressure from the outside is taken as positive, meaning the internal hydrostatic pressure acting outward on the tank wall is shown as negative relative pressure. As expected, the results correspond well with the theoretical hydrostatic distribution where pressure increases linearly with depth.
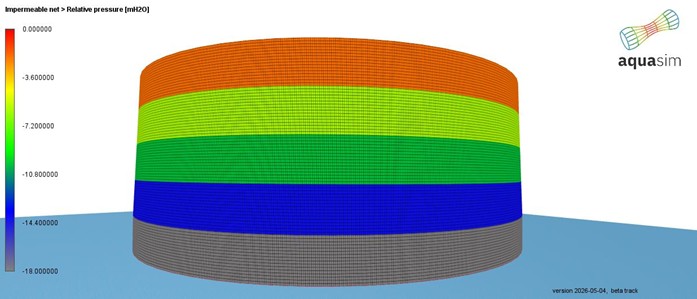
Figure 11 Relative pressure at element centres.
As seen from Figure 11 results correspond with location. Figure 12 shows the Von Mises stress distribution in the tank elements.
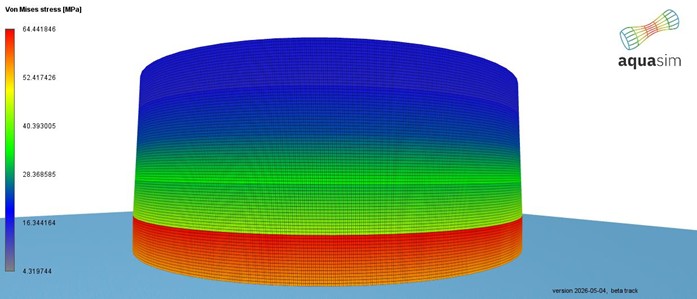
Figure 12 Von Mises stress
Summary
This tutorial has demonstrated how a water-filled, land-based tank can be modelled and analysed in AquaSim using membrane type Shell and the Close Compartment load formulation.
A cylindrical tank with a flat bottom was generated using the Generate Net option and positioned in air by placing the baseline at z = 0 or above. Shell properties were assigned to both the side walls and the bottom, and the internal water was defined through the enclosed volume parameters — specifying fluid density, fill height, and free surface area. Fixed boundary conditions were applied at the base nodes to represent a rigid foundation, while the rim nodes were released horizontally and rotationally to reflect realistic top-edge conditions.
The static analysis results confirm that the internal pressure distribution follows the expected hydrostatic pattern, with pressure increasing linearly from zero at the free surface to a maximum at the tank base. The Von Mises stress results provide a basis for structural assessment of the tank wall and bottom under the applied water load.
Although this tutorial covers a simple, unstiffened tank, the same modelling approach can be extended to more complex configurations. Additional structural details, such as stiffened panels, composite cross-sections, or partial fill levels, can be introduced using standard elements available in AquaSim.