Load cases, analysis results and verification
Last reviewed version: 2.22Load cases
There are performed analyses with waves with amplitude of 1.0m and periods ranging from 3.0s to 100.0s respectively, as shown in Figure 10. The waves move in the direction of the positive x-axis, i.e. red axis in Figure 5.
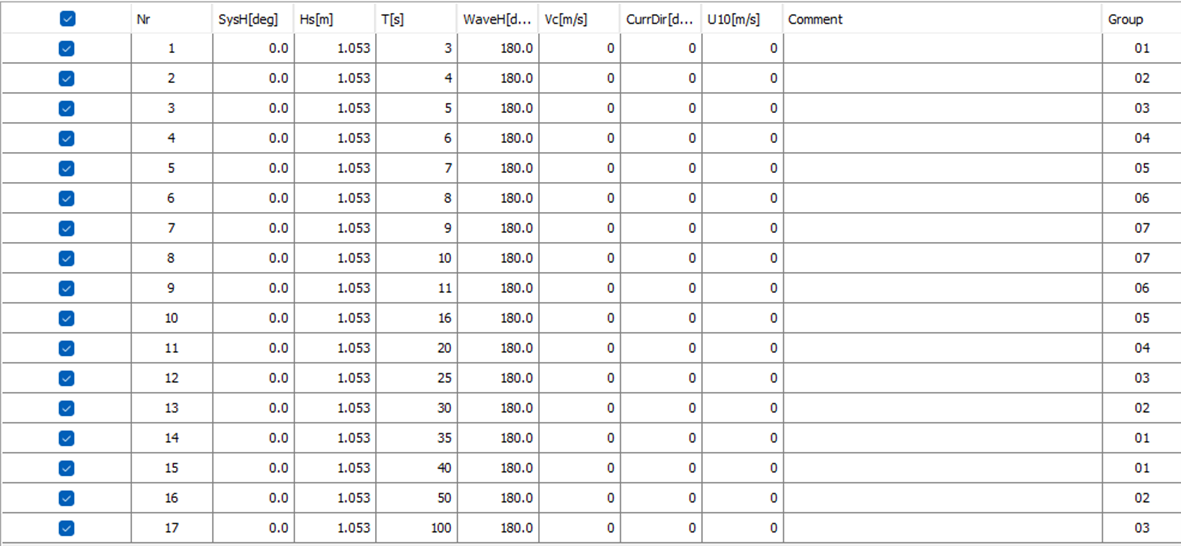
Figure 10 Environmental loads, for analyzed load cases.
Analysis results and verification
Total horizontal wave excitation force and phase
Figure 11 and Figure 12 provides the total horizontal wave excitation force and Figure 14 provides the phase, calculated by AquaSim using the “MacCamy-Fuchs” load formulation and the “Numerical diffraction” load formulation (NEMOH), but otherwise using the exact same analysis model, compared with the analytical long wave approximation, i.e. using Morison equation with added mass coefficient \(C_a=1.0\) and no drag \((C_D=0.0)\).
Very similar results are obtained between the “MacCamy-Fuchs” load formulation and the “Numerical diffraction” load formulation for all wave periods, as expected.
Furthermore, it is observed that both load formulations converge towards the analytical long wave approximation (Morison) for longer wave periods and good agreement is observed for wave periods T≥6.0s, which corresponds to wavelengths of λ>5*D, as seen in Figure 13, meaning the structure does not disturb the waves significantly and diffraction is of less importance, as expected.
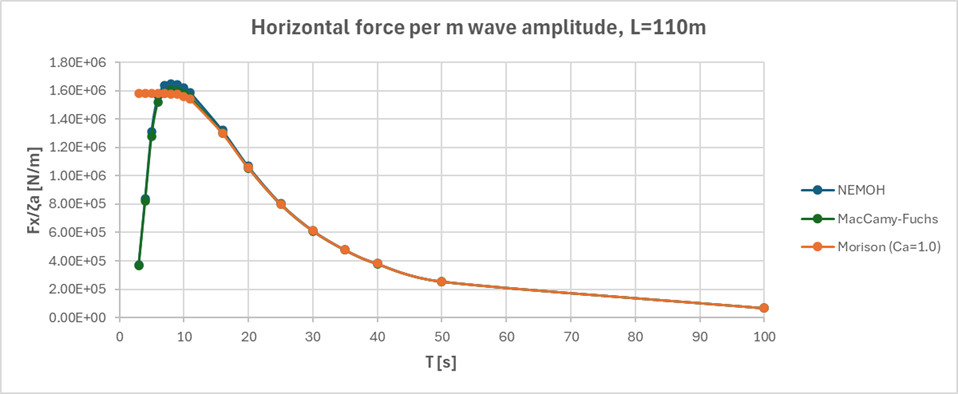
Figure 11 Comparison of horizontal force per m wave amplitude as a function of wave period.
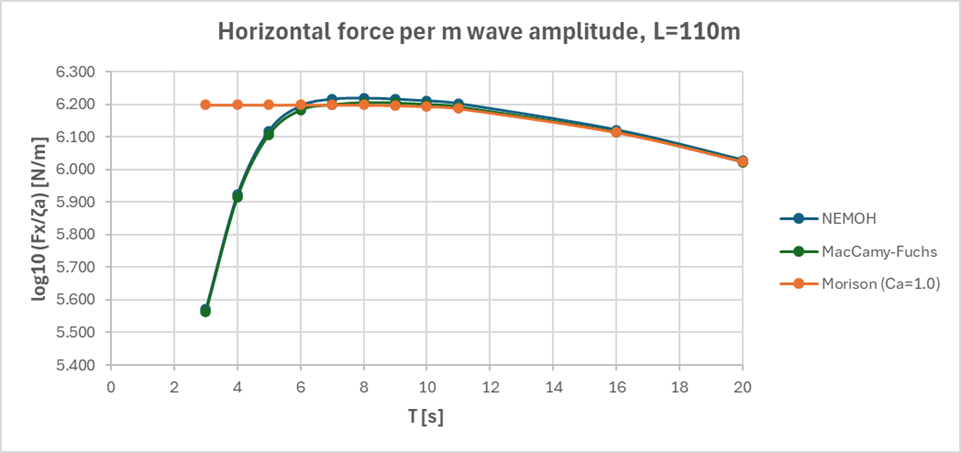
Figure 12 Comparison of horizontal force per m wave amplitude, with log10 scale and cut-off at wave period T = 20s.
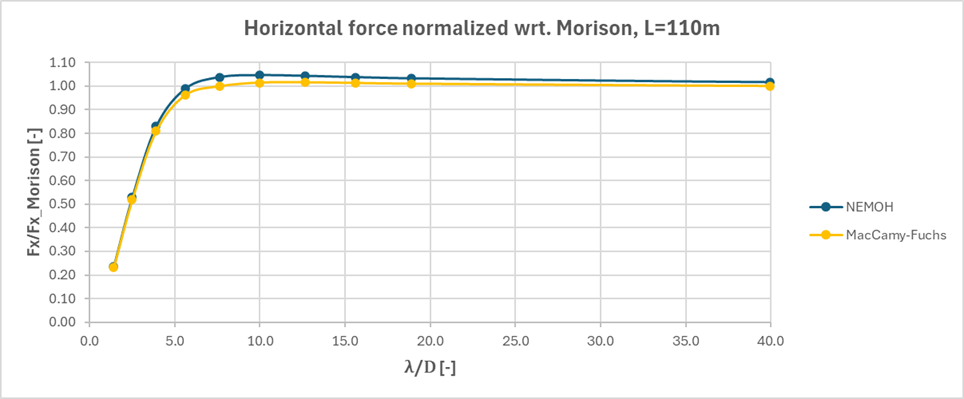
Figure 13 Comparison of normalized horizontal force as a function of wavelength divided by cylinder diameter.
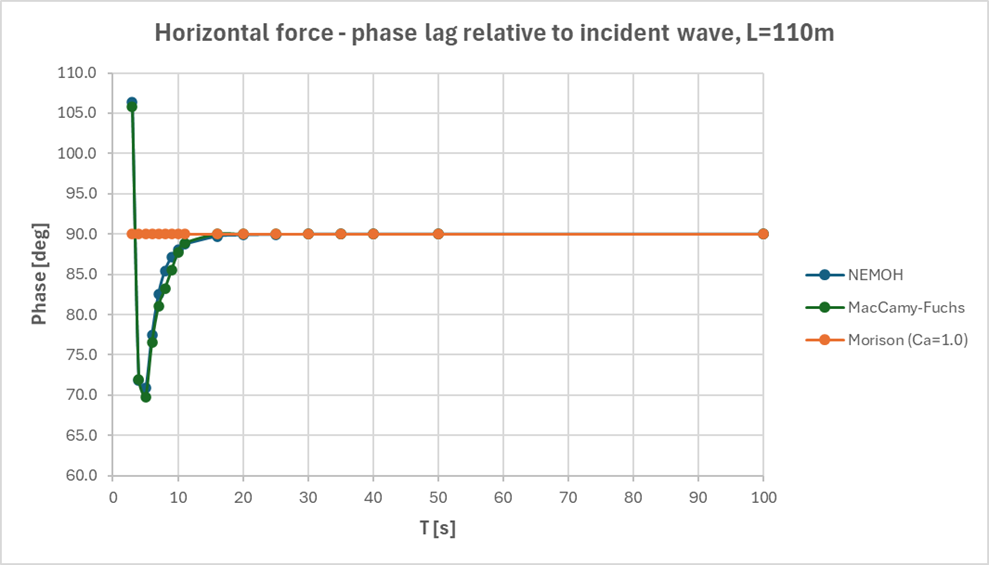
Figure 14 Comparison of the horizontal force phase lag relative to incident wave.
Added mass and hydrodynamic damping
Figure 15 provides the added mass and hydrodynamic damping acting on each panel as calculated by AquaSim using the “MacCamy-Fuchs” load formulation, while Table 3 provides a comparison between the total added mass and total hydrodynamic damping of the structure calculated by AquaSim and by analytical calculations.
Both the values of the added mass and hydrodynamic damping acting on each panel and the total for the entire structure obtained using the “MacCamy-Fuchs” load formulation are as expected and compare well to the analytical calculations.
| Parameter | AquaSim | Analytical | Difference [-] |
|---|---|---|---|
| A11 [tonne] | 8796.2 | 8796.2 | 1.00 |
| B11 [Ns/m] | 8796230.0 | 8796235.7 | 1.00 |
| A22 [tonne] | 8796.2 | 8796.2 | 1.00 |
| B22 [Ns/m] | 8796230.0 | 8796235.7 | 1.00 |
| A33 [tonne] | 8796.2 | 8796.2 | 1.00 |
| B33 [Ns/m] | 8796230.0 | 8796235.7 | 1.00 |
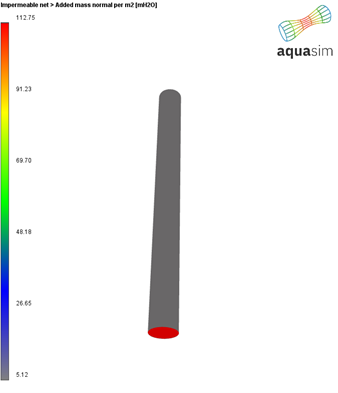
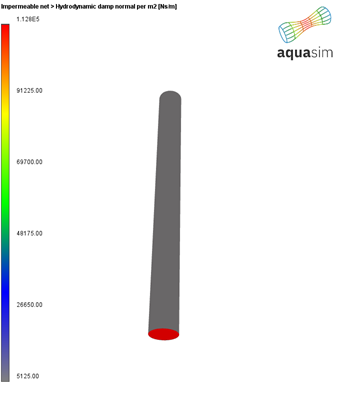
Figure 15 Added mass (left) and hydrodynamic damping (right), calculated by AquaSim using the “MacCamy-Fuchs” load formulation.
Notes on additional aspects
For additional details regarding preprocessing, meshing, drift forces, added mass waterline corrections, finite water depth, other aspects with respect to irregular waves, current-wave interactions, arbitrary motions/deformations, negative values for added mass and hydrodynamic damping, results/postprocessing (“avz-file”, “PFAT-file” and “Hydro-file”) and more, see tutorial (Aquastructures AS, 2025a).